
We analysed a years worth of data to transform the Art of marketing into a predictable Science. Most brands optimise their Meta advertising campaigns, in the same order. Audience first. Budget second. Creative last, refreshed when everything else has been tried.
Our data says that's the wrong order entirely.
PUSH analysed twelve months of Meta advertising across 35 client accounts, 1,430 ads and £3.3m of spend. We wanted to know which factor actually moves click performance. Not what the industry assumes. What our own numbers show. Science, not instinct.

Key Takeaways
- Creative accounts for 46% of Meta ad click performance. It is the single biggest lever in any account.
- Audience selection drives 32% of click performance. Campaign setup accounts for 19%. Timing accounts for 3%.
- PUSH's analysis covered 35 client accounts, 1,430 ads and £3.3m of spend across twelve months.
- Inside identical audiences and budgets, the best-performing ad pulled 49% more clicks than the average.
- CreativeIQ will allow you to analyse all your Ads and offer improvements
What did PUSH actually analyse to reach these numbers?
PUSH analysed twelve months of Meta advertising performance across 35 client accounts, covering 1,430 individual ads and £3.3m of total spend. The goal was to isolate which variable, creative, audience, campaign setup or timing, had the greatest measurable effect on click performance. Not what the industry assumes. What the numbers show.
The methodology used 2,313 head-to-head ad comparisons, holding audience, budget and time period constant to isolate creative as the variable. That isolation is what makes the finding meaningful.
Which factor has the biggest impact on Meta ad click performance?
Creative accounts for 46% of whether a Meta ad earns a click. Audience selection accounts for 32%. Campaign setup accounts for 19%. Timing accounts for 3%.
The ad itself is the single biggest lever in any Meta account. That's not instinct. It's science.
This challenges the standard optimisation sequence most brands follow. Audience and budget decisions are treated as the primary work. Creative is treated as the finishing touch. The data shows that sequence is reversed.
How much difference does creative quality actually make inside the same campaign?
Inside the same audience, the same budget and the same week, the best-performing ad pulled 49% more clicks than the average one. Same money. Same people. The only variable was the creative.
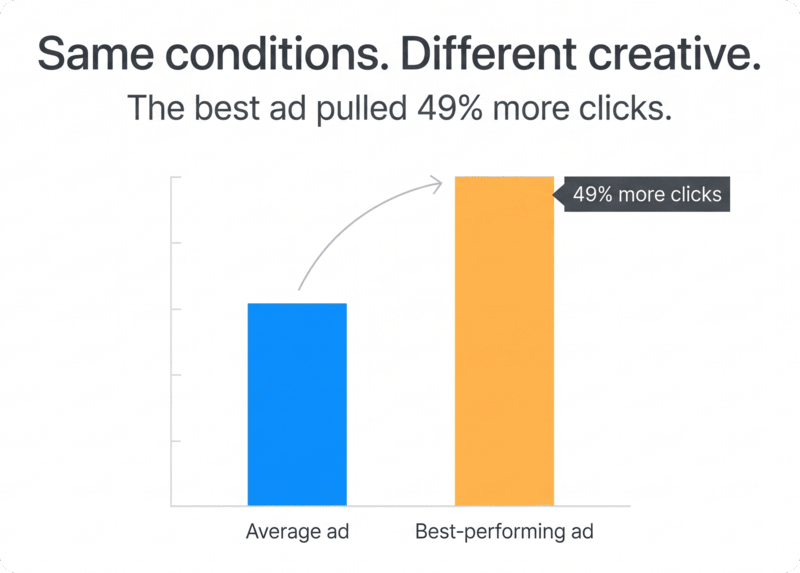
That held across 2,313 head-to-head comparisons, 35 clients and twelve months. It was not a quirk. It was a measurable, repeatable pattern. Art becoming something far more precise.
For any brand running paid social advertising, a 49% performance gap between your best and average creative is not a creative problem. It is a business problem with a solvable brief.
Does creative quality affect the full purchase journey, or just the click?
Creative drives nearly half of whether a user stops and clicks. Its influence on final cost per sale is roughly a third once someone has clicked through.
This is an important distinction. The data measures click performance, not purchase completion. Creative's share of influence falls further down the funnel, where landing page, offer and audience quality take over. What the data demonstrates is that creative controls access to the funnel in the first place. No click means no sale, regardless of what follows.
Why do most brands still not know what made their best Meta ads work?
Most brands do not have a structured way to analyse creative performance at the element level. Standard reporting tells you which ad won. It tells you nothing about what was inside it, which hook, which opening line, which creative decision turned instinct into a result.
If creative drives 46% of click performance and the gap between your best and average ad is consistently 49%, then understanding why your best ads win is the highest-return analysis any brand can run before Q4.
That is exactly the problem PUSH built CreativeIQ to solve. It takes the patterns inside your winning ads and turns them into a structured brief for what to produce next. Not guesswork. A repeatable process.
If nearly half of your Q4 performance lives inside your next creative brief, the most valuable conversation you can have right now is with PUSH. Speak to our Paid Social Team, to find out how CreativeIQ works in practice.
Time to get scientific.
Frequently Asked Questions
What percentage of Meta ad click performance is driven by creative?
Creative accounts for 46% of Meta ad click performance, according to PUSH's analysis of £3.3m in ad spend across 35 client accounts and 1,430 ads over twelve months. It is the single biggest driver of whether an ad earns a click, ahead of audience selection (32%), campaign setup (19%) and timing (3%).
How did PUSH measure the impact of creative on Meta ad performance?
PUSH ran 2,313 head-to-head ad comparisons over twelve months across 35 client accounts, holding audience, budget and timing constant in each comparison. This isolated creative as the variable and made it possible to calculate its proportional contribution to click performance.
Does creative quality affect cost per sale, or just click-through rate?
Creative has the strongest influence on whether a user clicks. Its share of final cost per sale falls to roughly a third once someone has clicked through. Factors such as landing page quality, offer and audience intent play a larger role in purchase completion. Creative controls access to the funnel.
What is CreativeIQ and what does it do?
CreativeIQ is PUSH's creative analysis tool. It identifies the patterns inside a brand's best-performing ads and uses those patterns to brief the next round of creative. The goal is to replace instinct-led creative decisions with a repeatable, data-backed process.
How much more clicks does the best Meta ad get compared to the average?
In PUSH's analysis, the best-performing ad inside any given audience, budget and time period pulled 49% more clicks than the average ad. This held across 2,313 comparisons, 35 clients and twelve months of data.